| Sounds, Images and Movies from |
|
||||||||||||
CTX |
|||||||||||||
Blake Shaw -- Fall Semester '03 |
|||||||||||||


Introduction
- This website is a collection of the sounds, images, and movies I've
created during my semester working at CTX.
I have been working with
Ben
Levitt and Professor
Mauel to try to better illustrate the data
collected at CTX by
using Mathematica and IDL. Furthermore, there are some images and movies
created with a webcam which help to
show how we make plasma at CTX.
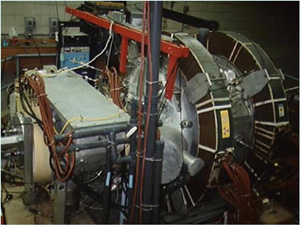
At CTX, we use a mechanically suspended dipole magnet to create a hot electron, ECRH plasma. We generally make a hydrogen plasma, although occasionally we use other gases. Microwaves are used to produce these energetic deeply-trapped electrons. We then use a variety of diagnostics to study the plasma.
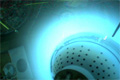
Images
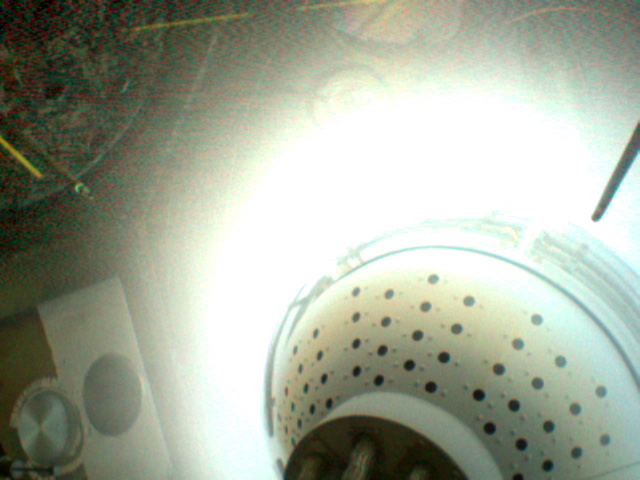
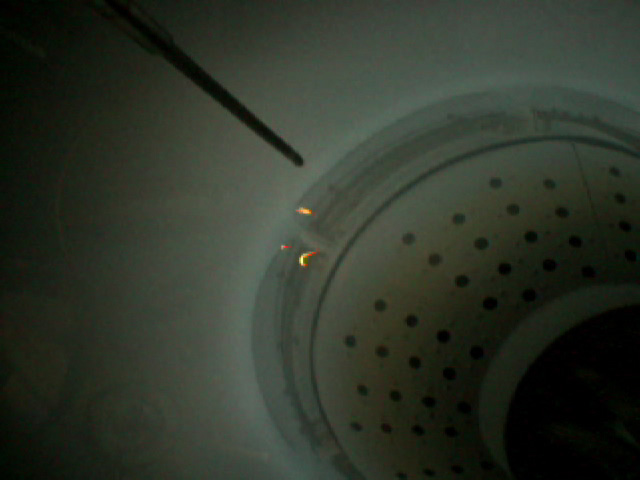
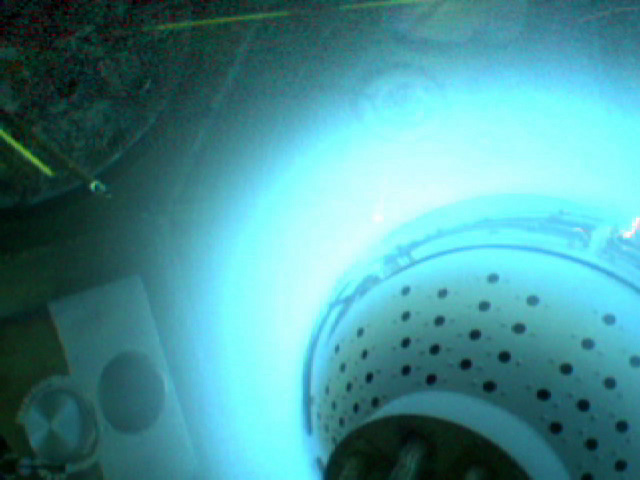
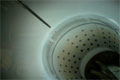
- Here is a collection of images created using a simple webcam. We mounted an Apple iSight to the exterior of the chamber looking in through a port hole, and then recorded a variety of different kinds of shots. These are the best frames extracted from those movies. These pictures clearly show the geometry of the deeply trapped dipole plasma, characteristic of CTX.
- The light that we see in these pictures is emitted from charged particles colliding with neutral particles. When a collision occurs, these neutrals become excited, and upon relaxation they emit photons. The number of neutrals is proportional to the density of the plasma. Therefore, in higher density shots we see more light emitted.
- Furthermore, it is interesting that the high density region appears to be so well defined. Plasma density is inversely proportional to the radius^4. However, we see a clearly defined boundary of light.
 |
|
 |
|
 |
|
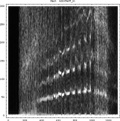
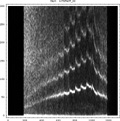
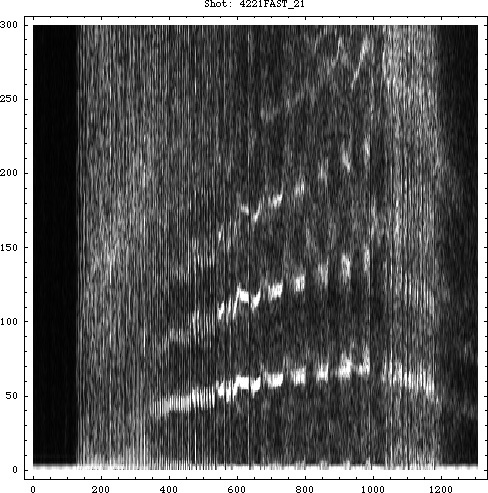
Sounds
-
These sounds were generated using Mathematica and IDL to help illustrate the rotationally driven interchange instability. Ben Levitt is using the tungsten mesh to induce an electric field, which in turn, rotates the plasma, and drives this instability. The data was taken from one of the fast floating potential probes and converted into a data file using IDL. The data was then imported into Mathematica and used to generate time frequency domain plots (TFDs) and sound files of the frequency content embedded in the fast floating probe data. Here is the IDL script. Here is the Mathematica File.
Movies
-
These movies are the original footage that we took with the iSight. They are in real time. During roughly the first .6 seconds, microwaves are being used to heat the plasma. However, afterwards there is an afterglow period when, although the heating is off, the plasma persists. This period is the clearest part of the shot because we believe that the microwaves interfere with the CCD in the iSight.
 |
|
 |
|
-
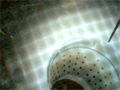
In order to try to reduce the microwave interference, we built a Faraday cage. We used a fine wire mesh surrounding the iSight to try to reduce the effects of the microwaves. This did allow us to see more of the shot without interference. However, the wire mesh was still substantial enough to obscure the view.
 |
|
-
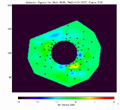
These movies are created using the polar grid detector. The data from the detectors are processed in IDL and combined into movie files. The IDL code is adapted from Ben Levitt's original code. It uses cubic spline interpolation to create a polar contour surface from a set of irregular grid points. The orange and yellow colors represent areas of positive charge, and the blue and purple colors represent areas of negative charge. The black dots are the locations of the polar grid detectors.
- With these movies, we are trying to observe drift waves rotating at roughly 5 khz. In the future we would like to use this setup to observe the rotation of the plasma when we induce an electric field with the tungsten mesh. However, currently the polar grid detector hardware isn't sensitive enough yet to be used in the lower density regime in which we currently use the meshes.
- In these movies we can see some subtle signs of rotation. Not all the detectors are working, which can be clearly seen by some strange effects in the upper right corner of the plot. However, some drift waves are noticeable.
 |
|
Source Code: download this zip package. Read Me included. |
Thanks
- Thanks so much to Professor Mauel for the opportunity to work at CTX this semester, and Ben Levitt for teaching me so much about how CTX works.