Friday, May 13, 2005

Machine Learning Techniques for Visualizing CUtunes Data

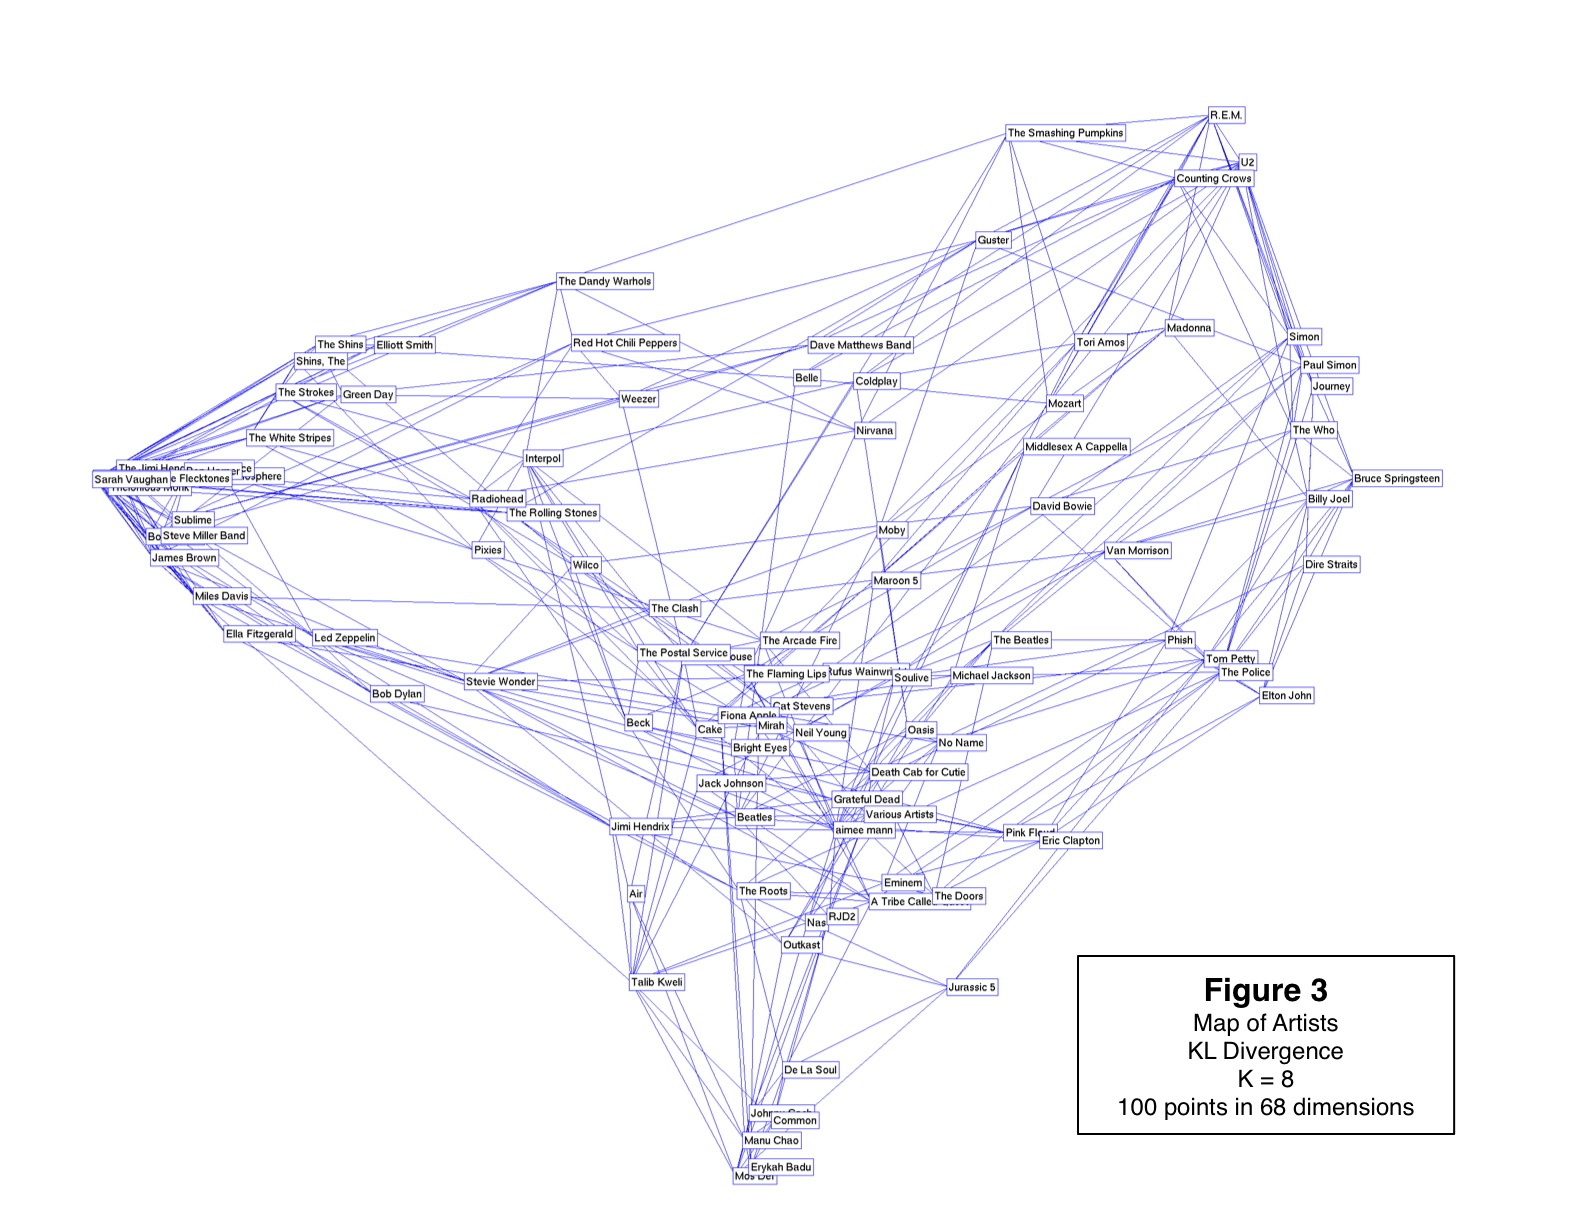
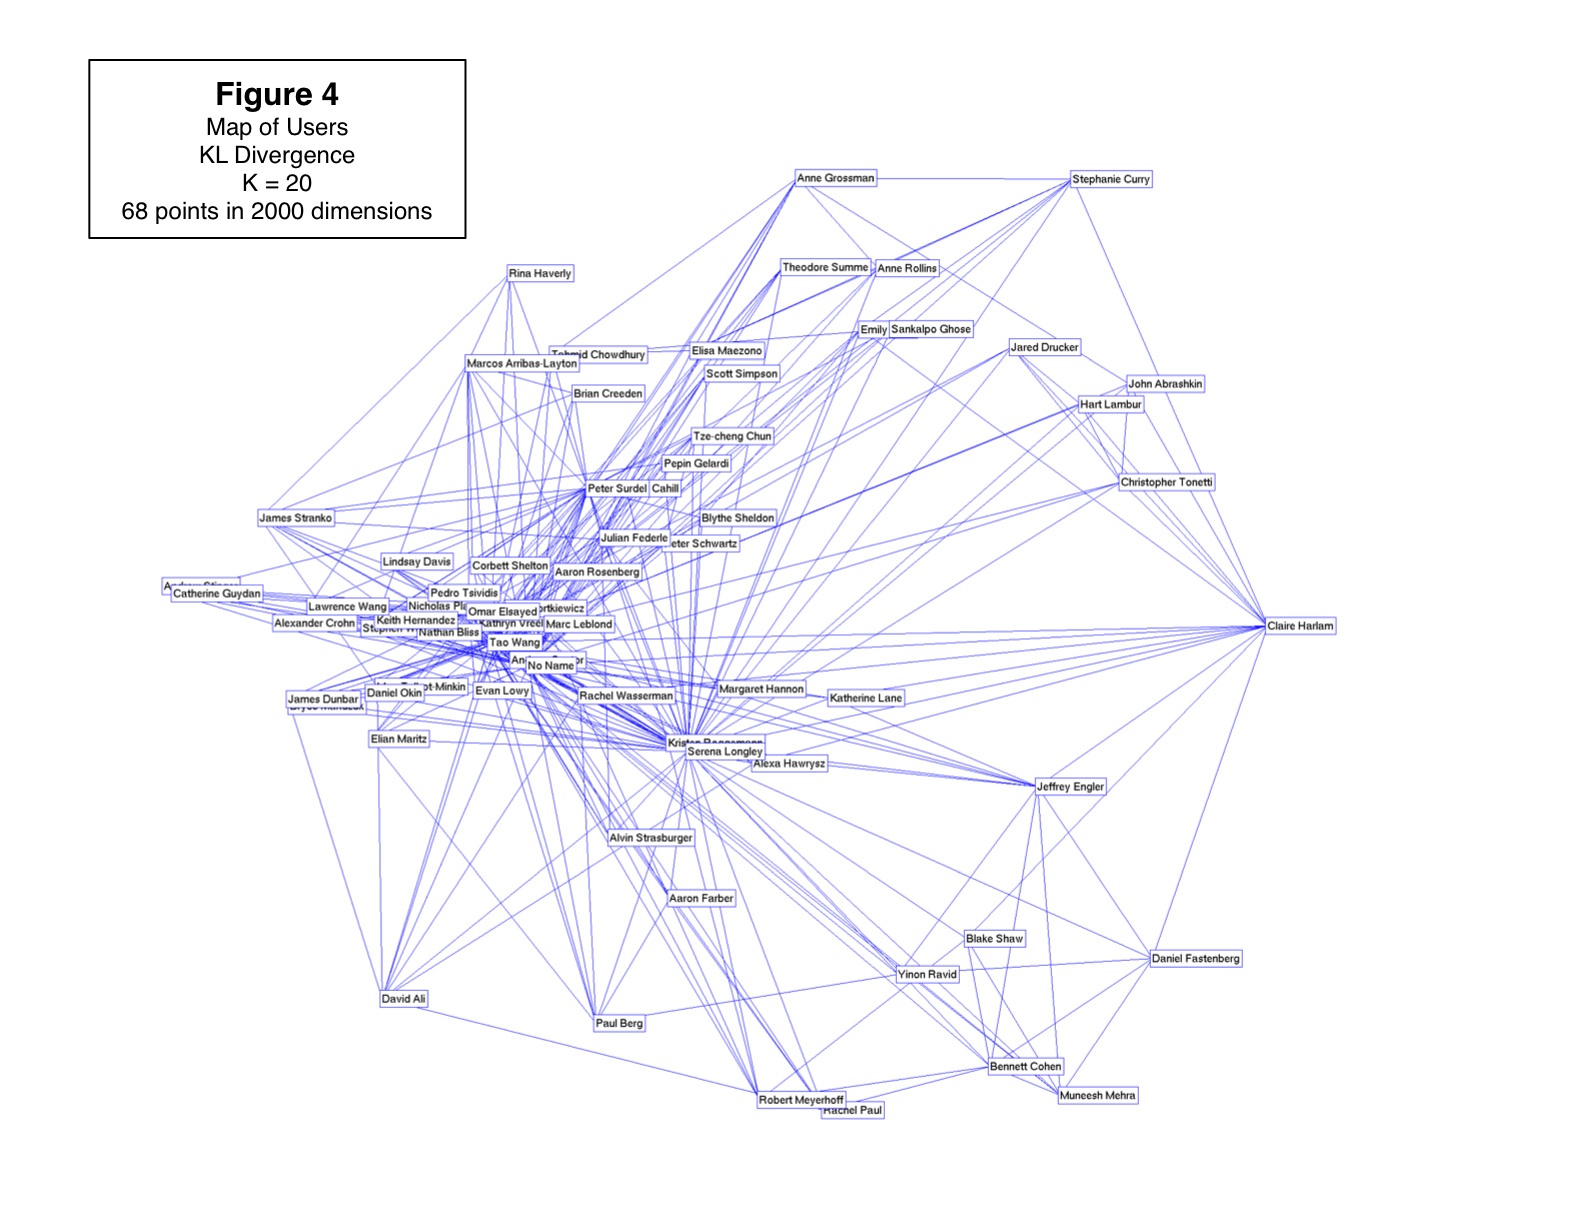
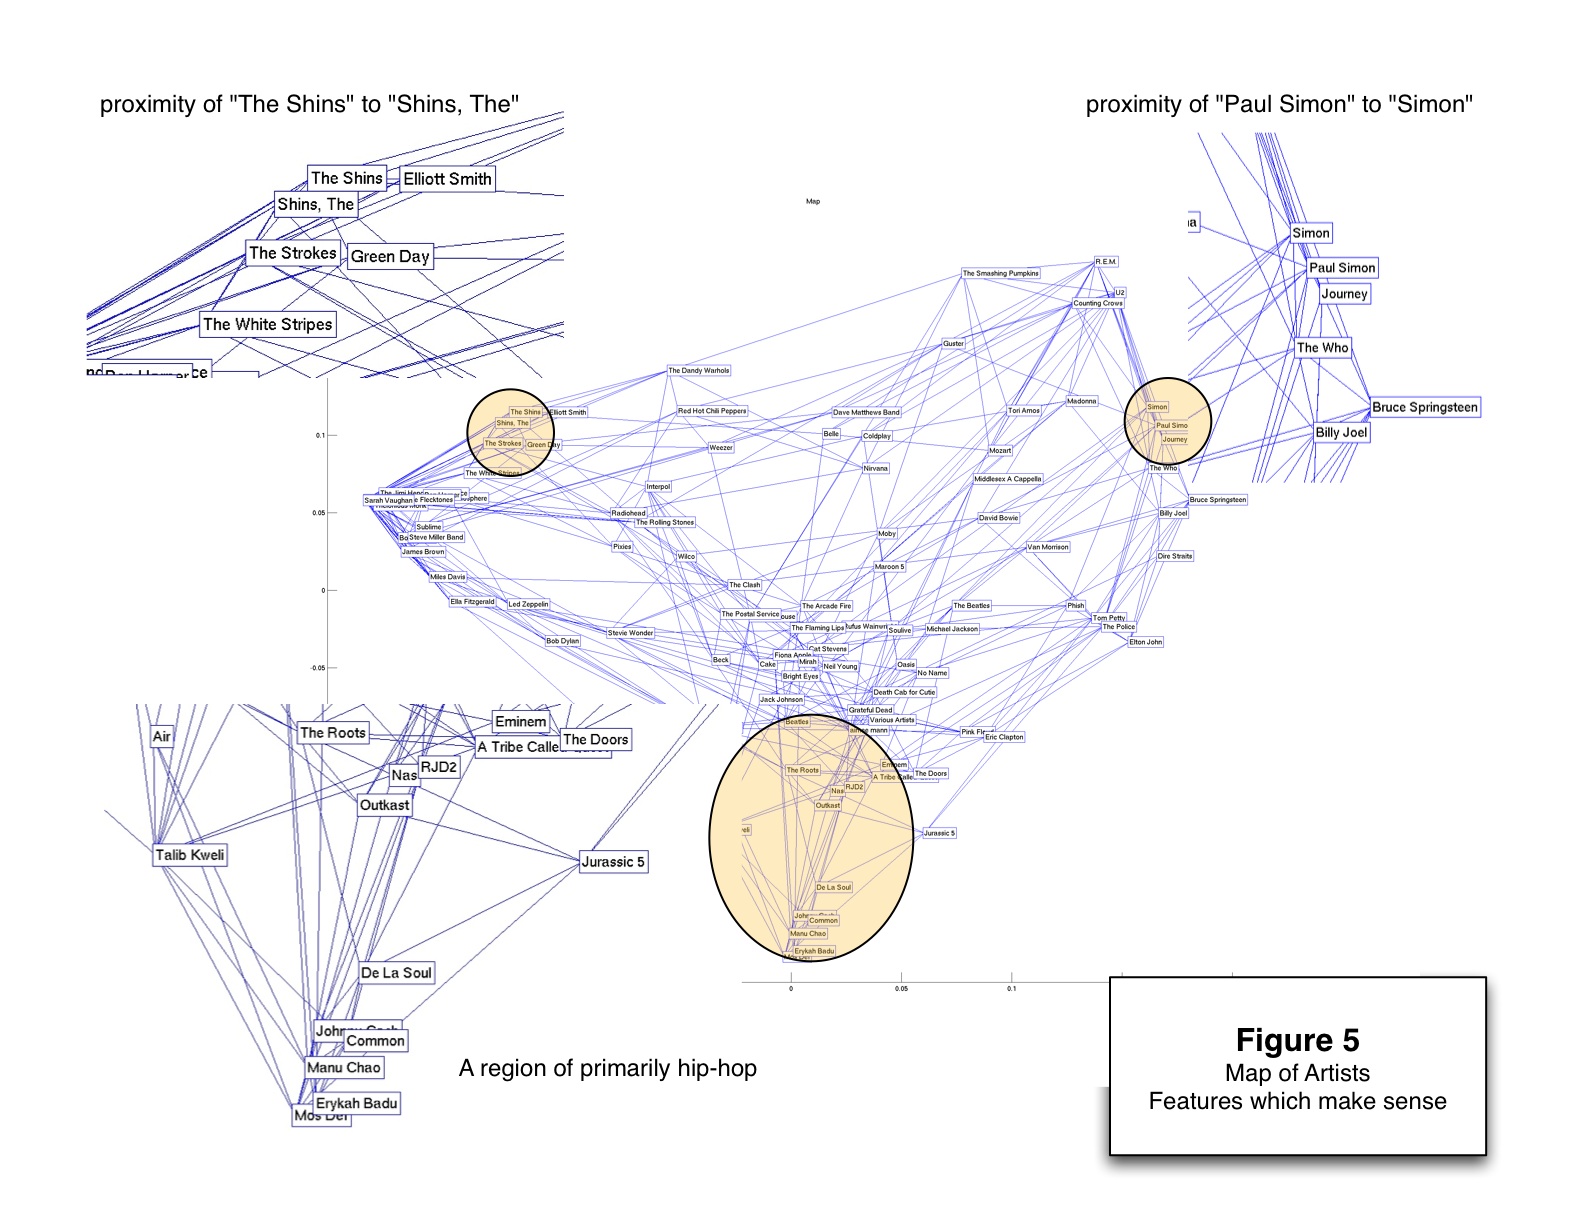
Here are some cool images generated using CUtunes data. The first is a map of users, and the second is a map of artists. Distance on the map is a measure of similarity. The third points out some interesting features of the artist map.


Machine Learning Final Project: Locally Linear Embedding for Visualizing High-Dimensional Data


CUtunes

CUtunes is a tool for exploring the music listening habits of the Columbia University community. We provide basic services, including lists of top 40 songs, albums, and artists being played, as well as compatibility ratings between users, and recommendations for new music.


I started this project with a few other students this semester. Here is our end of the semester report.


CUtunes Project Report


LLE/NMF for Visualzing Clusters in Genetic Data

For my computational genomics class this semesters we created a tool to visualize clusters in gene expression data collected from microarrays. Here is a link to the paper, and an image from our analysis of a leukemia data set.


CS4761 Project: Visualizing Clusters in Microarray Data